Games for bt2
QEEG’s record data from 20 or more standard EEG sites on the head. This is done during eyes-closed, eyes-open and task conditions. The result is a picture of how brain activation changes from resting to awareness to active processing states. The Q removes “artifacts” (electrical signals in the EEG which do not come from the brain) and presents the data in terms of the main measures of brain activity: frequency, amplitude, stability and connectivity.
Any QEEG system performs these basic functions. Most use some form of Electro-Cap to speed up hookup and recording. Most have some form of artifacting routine as well. Ideally the data are recorded, cleaned and loaded in less than 30 minutes.
There are two major approaches to looking at all this data
Population-based
Compares hundreds of measures from the client against a database of people recorded over the past 30 years to produce dozens of “z-scores”—specific measures in specific areas of the client’s brain which differ from “average”. Whether these differences are positive or negative, adaptive or mal-adaptive is not clear.
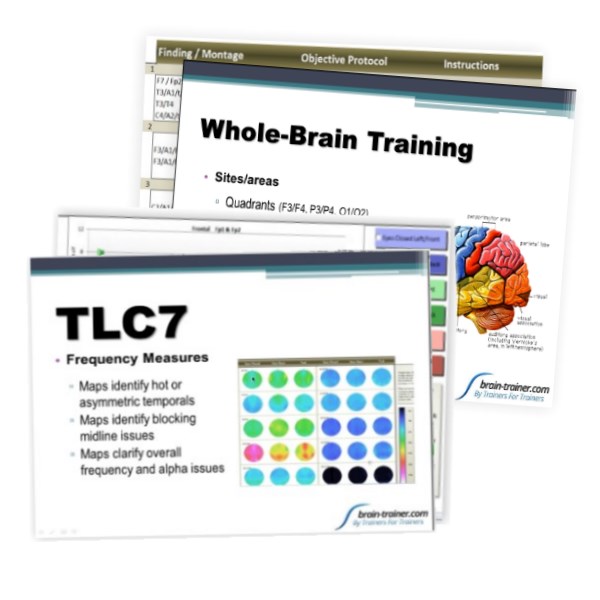
Pattern-based
Identifies Stable Activation Patterns that have been linked in QEEG research to problem areas in a person’s life. These were developed by comparing people with specific training issues (e.g. anxiety, ADHD) against the population to see where they reliably differ. If a pattern present in the client’s brain is consistent with the training goals, training to change the pattern can be expected to change the mood, behavior, performance or symptom.
The educational printing services offered by Print Design make us one of the most trusted and
sought-after graphic design and printing companies around.
At Brain-Trainer we believe “Less is More”. Population-based QEEG’s are great for research, but they cost more, take longer and don’t focus on your practical questions. They can’t distinguish between useful and problematic variances, so they risk training down the client’s strengths. By skipping the database, the TQ7 leaves out the mountains of data and the focus on “average” to identify those tendencies related to training goals.

Gray-matter injuries kill neurons. Most immediately the brain shows lower amplitudes in all frequencies. The brain replaces these neurons over time, but the new neurons may not re-form the connections of those which are lost. Result: a spike in Alpha that does not go away with eyes open or at task.
White-matter injuries tear axons, breaking neuronal connections. The neurons keep firing, but they can’t receive or pass along signals, so they pulse at the Delta rhythm. White matter cannot be repaired. Result: a spike in Delta that does not go away with eyes open or at task.
Fast-brain patterns can be related to stressed, anxious, angry, obsessive states—being stuck in “fight-or-flight”. Because this brain burns so much energy, even at rest, adrenal fatigue, low energy levels and depression can result as well. The hotter the brain is on the right hemisphere and/or right-rear quadrant, the more problematic.
Slow-brain patterns may be depressed, inattentive, dreamy, have difficulty processing language or working with sequences and hierarchies. When the brain de-activates (gets slower at task) it is metabolically unable to sustain higher energy states involved in processing.
The Anterior Cingulate is involved with motivation and it is the spigot that controls the flow of emotions from the limbic system to the prefrontal. When emotional drive is very strong—or the brain’s strategy is to deny feelings—the cingulate has to work very hard (Amen’s Hot Cingulate), but we often see it nearly shut down after years of over-use.
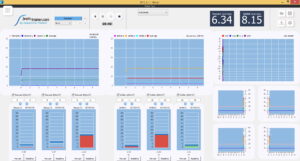
Histograms
Compare left and right amplitudes in 10 frequency bands for each brain area during eyes-closed, eyes-open and challenge conditions.
Report Pages
Color-coded tables of important data. Measures are arranged so that red numbers suggest readings higher than expected and blue numbers suggest readings lower than expected.
Synchrony Pages
Synchrony is the brain’s ability to communicate efficiently within itself. The Synchrony page shows levels of coherence and phase locking between the two members of a site pair, e.g., left and right front, for all frequencies, sites and conditions.
Analyze Page
Summarizes findings from the full assessment and identifies in a single display the training categories that suggest potential problem areas.
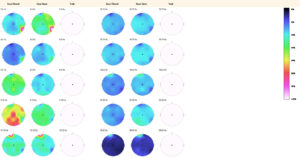
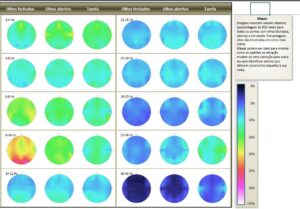
Frequency Distribution Maps
Maps show the % of brain activity at 10 key frequencies around the brain and how patterns change in eyes-closed and eyes-open resting states and at task.
Heads Display of Absolute and Relative Amplitudes
The Heads displays array data around the head, color-coded by frequency, to make it easier to compare absolute values (left head) and relative values (right head).
(Need a BT2 License)